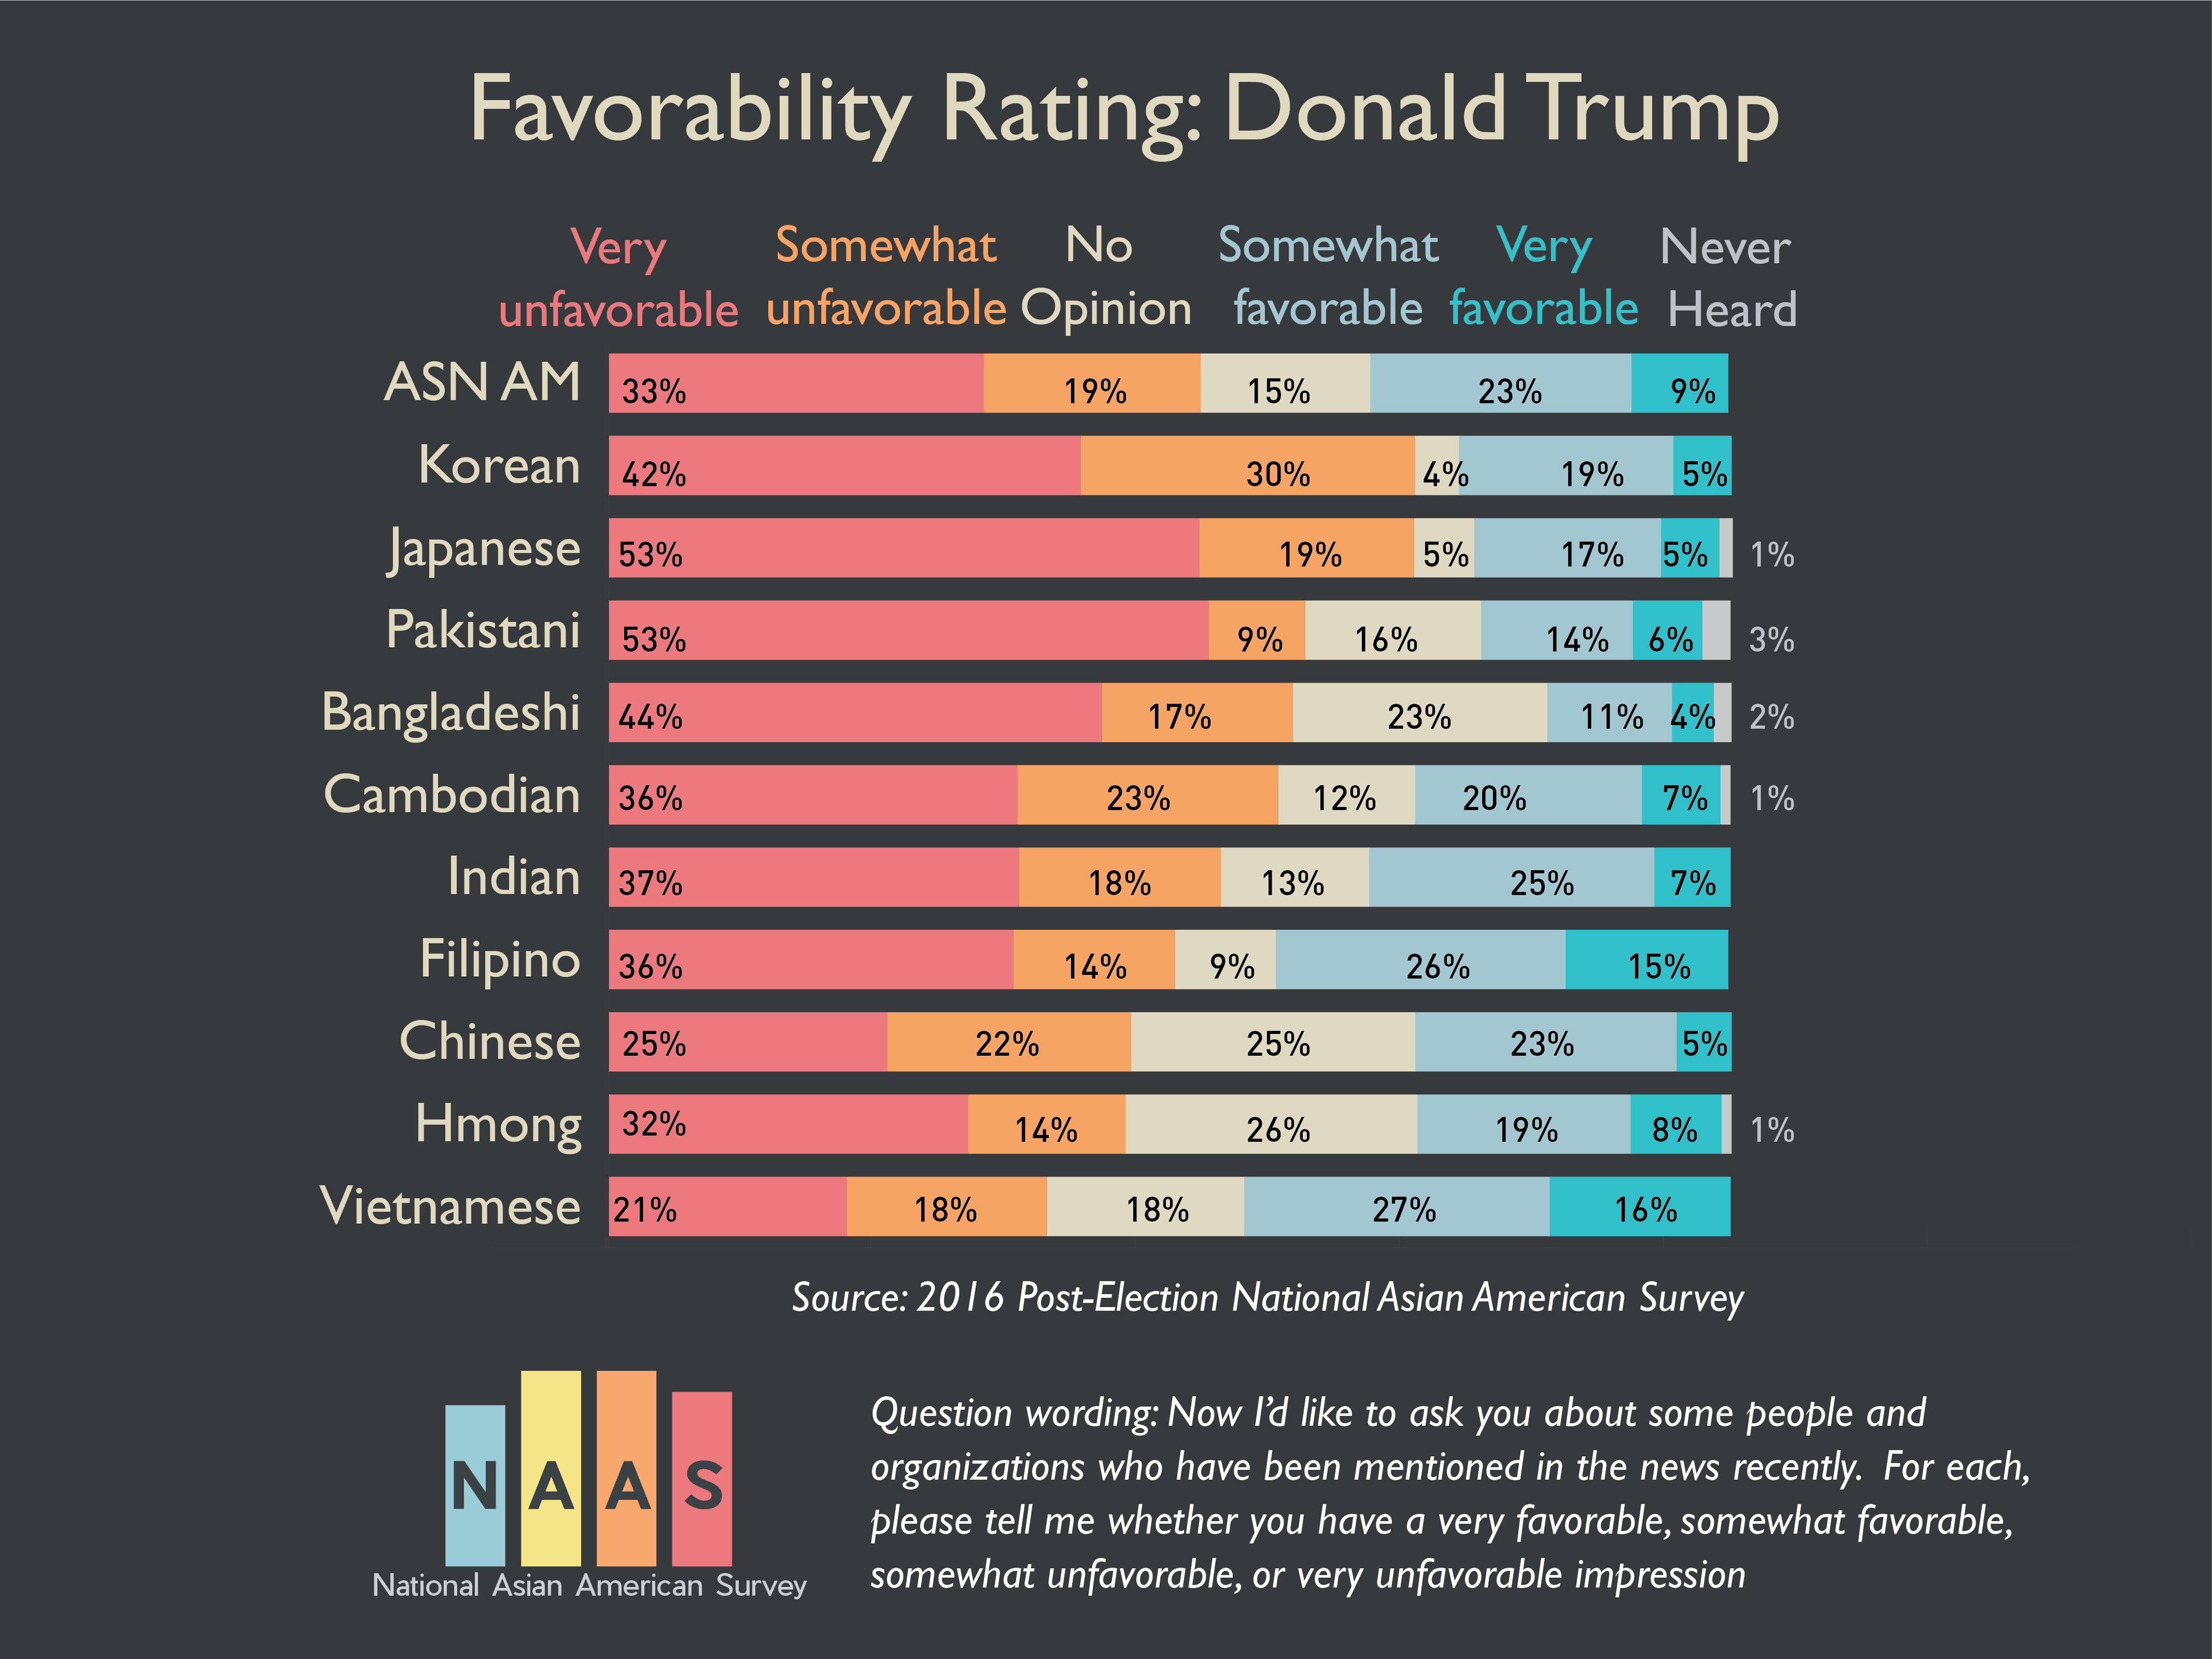
BY KARTHICK RAMAKRISHNAN Donald Trump is viewed very unfavorably by Asian Americans, according to data from the 2016 Post-Election National Asian American Survey (NAAS). Only 32 percent of Asian Americans hold a favorable view of Trump, with 9 percent viewing him very favorably. By contrast, 52 percent of Asian Americans view Trump unfavorably, with about a third viewing him very unfavorably. Unfavorable views on Trump were especially high among Korean, Japanese, and Pakistani Americans. Even among Chinese […]
In 2016, Asian Americans Had A Record In...
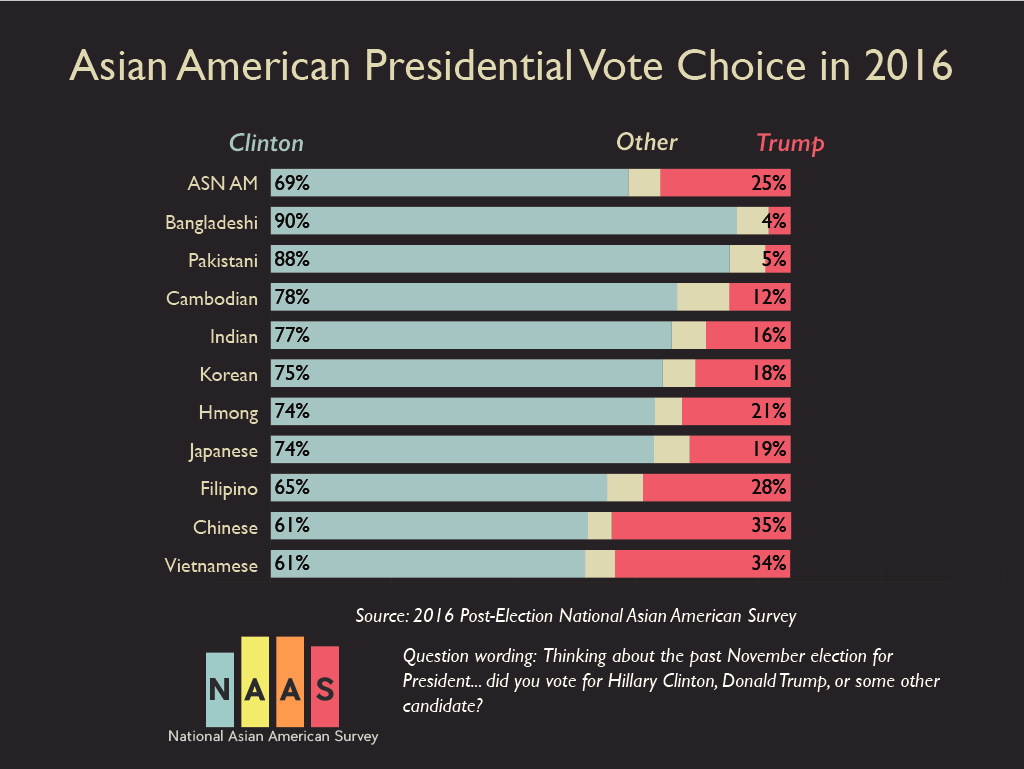
Clinton won every segment of the Asian American vote, but some political differences are emerging RIVERSIDE, California – In 2016, Asian Americans posted record gains in voting, with more than 1.1 million new voters. By comparison, in the three prior presidential cycles, the average increase was about 620,000 new voters per presidential cycle, with the largest prior increase of 723,000 voters occurring in 2004. The 2016 Post-Election National Asian American Survey (NAAS) was designed by […]
Views of a Diverse Electorate (with Fiel...

September 25th, 2015 Where does California Stand on Affirmative Action? PDF of our poll report (with Field Poll) September 25, 2014 The United States is diversifying rapidly along the lines of race and ethnicity, and perhaps nowhere is that more apparent than in California, a state where no racial/ethnic group is a majority (California has been a majority-minority state since 2000), and where Latinos are now the largest racial/ethnic group among residents in the state. […]
Where do Asian Americans Stand on Affirm...
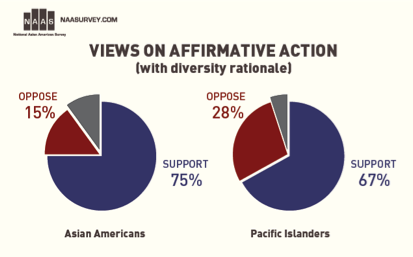
June 24, 2013 The U.S. Supreme Court affirmed the ability of universities to attain the educational benefits of diversity by implementing race-based affirmative action programs, but narrowly tailored it to apply only when no workable race-neutral alternatives would produce the educational benefits of diversity. Where do Asian Americans and Pacific Islanders stand on the issue of Affirmative Action? In our 2012 National Asian American Survey, we asked “Do you favor or oppose affirmative action programs […]
Growth of AAPI Electorate in 2012 (with ...

Asian American Voters Continue Decade-Long Trend, Add 500,000 New Voters WASHINGTON, DC, June 5, 2013 Asian American Justice Center (AAJC), Asian and Pacific Islander American Vote (APIAVote), and National Asian American Survey (NAAS) today issued the following statement on the release of census analysis on the voting participation rates in Election 2012: The latest Census Bureau analysis confirms that the Asian American electorate is on the rise. In line with our estimates from the “Behind […]
2012 AAPI Post-Election Survey (with AAJ...
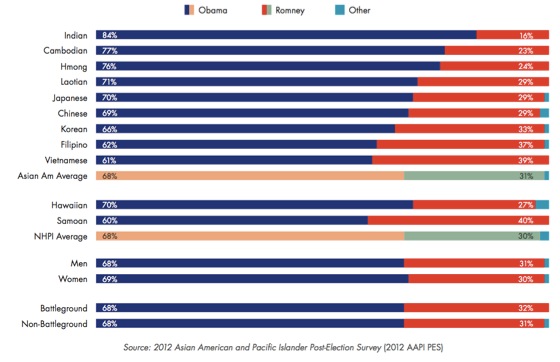
Read the report Asian American and Pacific Islander Voters Up for Grabs, Survey Finds WASHINGTON, DC, April 5, 2013 Asian Americans and Pacific Islanders, two of the fastest-growing demographics in the U.S. are open to persuasion by either major party at the ballot box, a new survey released today revealed. The findings in “Behind the Numbers” are the result of a survey that interviewed approximately 6,600 AAPI voters in 11 languages after Election Day sponsored […]
Asian Americans and U.S. Immigration Pol...
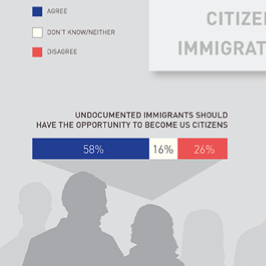
Key findings in this report include: Federal immigration policy is particularly important to Asian Americans. About three in four Asian American adults are foreign born. Since 2008, Asia has been the largest regional source of immigration to the United States. 58% of Asian Americans support a path to citizenship for undocumented immigrants in the United States. This represents a dramatic change from 2008, when just 32% of Asian Americans supported a path to citizenship for […]
Asian Americans and the Fiscal Cliff

The National Asian American Survey (NAAS) conducted the first nationally representative survey of the policy priorities and issue preferences of Asian Americans in 2008. In 2012, we conducted a tracking survey of Asian Americans and Pacific Islanders, with even more ethnic groups than in 2008 (Hmong and Cambodian, in addition to Chinese, Indian, Filipino, Vietnamese, Korean, and Japanese) and with the addition of Pacific Islander groups such as Native Hawaiians and Samoans. This report presents […]